Perhaps the very first skill learned in the Summers lab (after axenic culturing technique) is the chlorophyll A extraction. Since we work on filamentous bacteria, classic techniques, such as measuring the turbidity of our cell culture (such as by measuring OD720) is quite difficult. Clumps of bacteria form during log and stationary phase and cause inaccurate results by shielding other bacteria from detection.
The solution to this is by extracting, and measuring, a pigment found in these cells called chlorophyll A. If you’ve ever cracked open a biology book or watched a Planet Earth or Discovery Channel special on plants you’ve surely heard of this molecule. Chlorophyll A is responsible for absorbing energy from light, and ultimately donating that energy in the form of electrons to neighboring photosystems I and II. These photosystems eventually create the proton gradient that fuels ATP synthase and creates ATP.
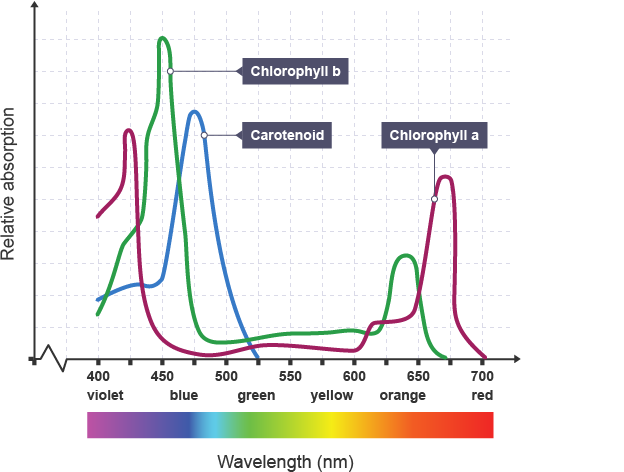
Every cell (eukaryote and prokaryote) that undergoes oxygenic photosynthesis contains chlorophyll A, so we can hypothesize that if a culture has doubled in size (total cells), it should contain around double the amount of chlorophyll A. Measuring it is simple enough, and the results are very consistent. A simple graph of common pigments found in photosynthetic organisms and their absorbances is shown below.

As you can see, chlorophyll A has 2 peaks. One around 430 nm and another around 670 nm. In our lab, we measure the absorbance of chlorophyll A at 665 nm since there’s less interference from other pigments.
Materials:
100% methanol (MeOH), for extraction
90% MeOH, blank
1 mL cell culture, usually taken from a larger 50 mL culture grown in AA/4
Micropipettes
Micropipette filter tips
1.5 mL Eppendorf tubes
Spectrophotometer
Vortexer
100% ethanol for washing cuvettes
Method:
- Turn on the Spectrophotometer to warm it up, more accurate results are recorded if it has at least 15-20 minutes to warm up.
- Remove 1 mL (1000 µL) of THOROUGHLY MIXED cell culture from 50 mL flask and transfer to a labeled Eppendorf tube.
- Ensure small clumps are broken up by pipetting up and down against the glass of the Erlenmeyer flask.
- Centrifuge at 17,000 x g for 1 minute
- Remove 0.9 mL (900 µL) of supernatant from each sample
- Add 0.9 mL (900 µL) of 100% MeOH to each sample, this creates a 90% MeOH solution within the tube.
- Vortex vigorously for ~30 seconds, until no clumps remain in the tube
- Incubate tubes in the dark for at least 5 minutes
- During this time, blank the spectrophotometer with 90% MeOH
- Set the measured absorbance to 665 nm (usually set to this already)
- The volume you use to blank should be consistent with the amount you will measure in your samples
- Wash out the cuvette with 100% ethanol (EtOH), discard in waste beaker.
- Dry out the cuvette by covering it with a Kimwipe and shaking it.
- Transfer 100–1000 µL of chlorophyll A extract to cuvette and measure the ABS665
- Repeat steps 8–10 for all your samples, then record results
NOTE:
- For best results, always use the same cuvette for measurments
- If the ABS at 665 nm reads above 0.8, it is wise to dilute the sample in the cuvette by at least 1:2 with 90% MeOH. This high reading may be inaccurate due to oversaturation of the detector, so a 1:2 dilution will alleviate any inaccuracies. Simply multiply THAT reading by 2 to give you your corrected ABS.
Interpreting the results
Now that you’ve recorded your data, you may be asking what to do with it. You can use these numbers on their own in a graph, but what is typically done is multiplying them by 12.7 (a constant figured out by someone long before my time as a grad) which translates your decimal number to µg chlorophyll A per mL of media. This makes graphs a little bit cleaner, and most publications use
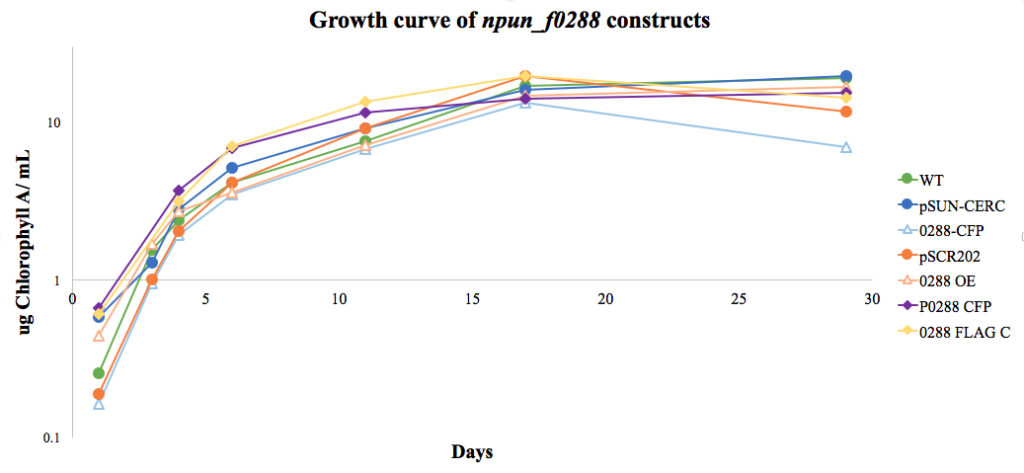
“µg ChlA/mL” as their Y-axis label in growth curves, so it keeps your results easy to read for other cyanobacteria scientists. An example of one of my growth curves is shown below.

This graph is the summary of a growth curve I did comparing the growth rates of 3 experimental strains which I genetically modified (0288-CFP, 0288-OE, and 0288 FLAG C) vs their respective control strains (pSUN-CERC, pSCR202, and P0288 CFP). Wild type (WT) was also measured as a negative control. As you can see, 0288-CFP showed a significant dip in growth by about 17 days. This implies that that strain can’t survive very well during stationary phase, which is a great phenotype to discover! All of the cultures shown in this graph were grown with the same conditions, in the same type of media. The next steps are to add a T-test and error bars (which i’ve removed here), and your graph is complete!
Hopefully now you know how to measure growth in Nostoc punctiforme, and also interpret the results! If you have any questions feel free to email me and I’ll clear it up!