The purpose of this page is to showcase the various work I’ve done in the lab. It will likely be updated and refined over time, think of it as indefinitely under contruction. If you’re interested in learning how to do something posted here—or you’d like to know the certain methods I followed—feel free to check out my Protocols section or shoot me an e-mail. Each picture will eventually contain a link to its respective protocol.
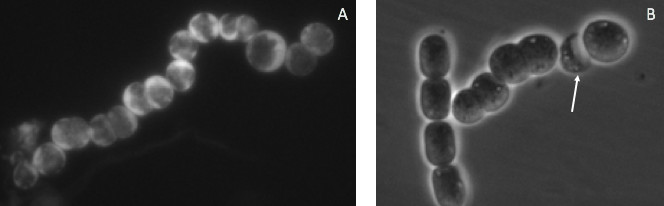
![A: Epifluorescence micrographs of a filament of N. punctiforme expressing a transcriptional reporter plasmid. GFP inclusions are highlighted as red arrows—1000x magnification. [B] Same filament as [A] but captured with lower exposure settings. [C] Autofuorescence of filament in [A]. [D] Wild-type (WT) filament of N. punctiforme which does not contain the transcriptional reporter plasmid. Exposure settings are equal to micrograph [A].](http://shgeiger.com/wp-content/uploads/2016/05/transcriptional_reporter.jpg)
![[A], [B], [C], [D], [E] Various filaments of N. punctiforme expressing a translational reporter plasmid fusing a gene of interest to the gene encoding cerulean fluorescent protein (CFP). Nearly all filaments expressing this protein chimera show compromised cell-cell contacts and polar localization of the protein.](http://shgeiger.com/wp-content/uploads/2016/05/translational_fusion.jpg)
![[A], [B], [C] Filaments of N. punctiforme expressing the same translational fusion protein as in the series of images above. Filaments were stained with the neutral lipid-staining dye BODIPY. Neutral lipids appear as bright inclusions in the center of most cells. [D] WT N. punctiforme stained with BODIPY](http://shgeiger.com/wp-content/uploads/2016/05/cfp_fusion_stained.jpg)
![[A], [B], [C] BODIPY-stained filaments of N. punctiforme over-expressing a protein of interest. Notice the size, aggregation, and positioning of the neutral lipids. Proteins are over-expressed by cloning the genes encoding them into a high-copy plasmid which yields around a 100-fold increase in protein expression. [D] WT N. punctiforme stained with BODIPY](http://shgeiger.com/wp-content/uploads/2016/05/ld_staining.jpg)
![[A] Homology model of a certain protein of interest. Ribbon-only. [B] Ball and stick model of [A]. [C] Merge of [A] and side chains-only of [B]. [D] Hydrophobicity plot layered over image [C], blue represents hydrophilic residues while red represents hydrophobic residues. All images generated using UCSF Chimera software.](http://shgeiger.com/wp-content/uploads/2016/05/chimera_models.jpg)
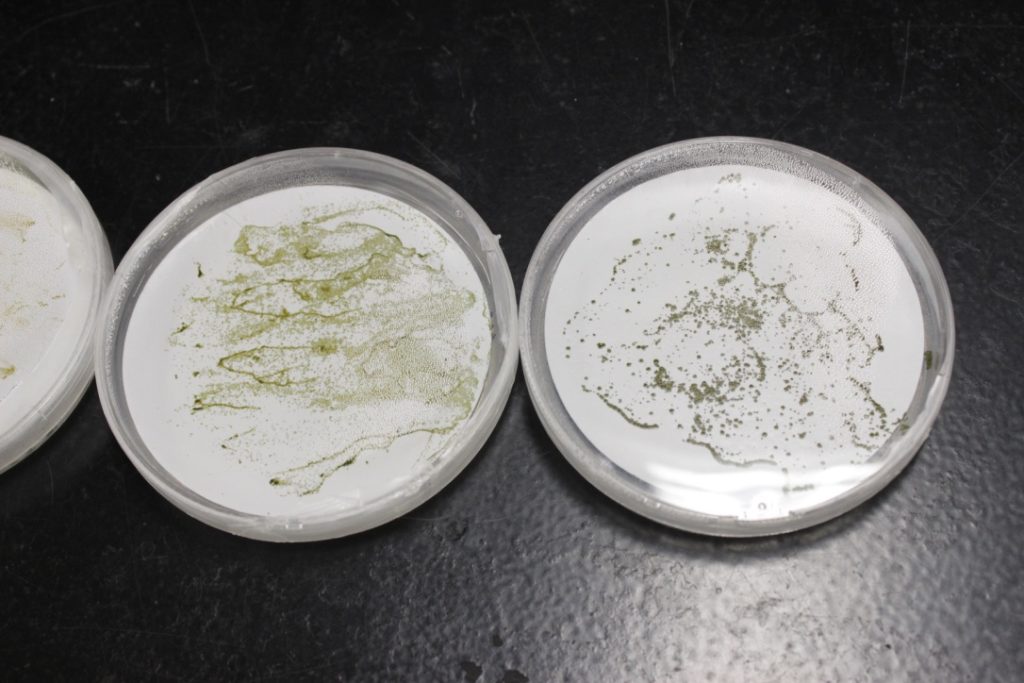
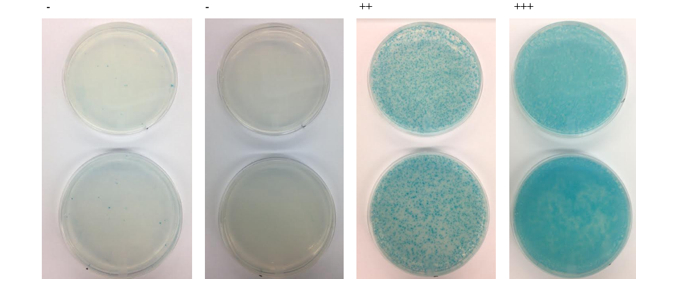 Example of bacterial two-hybrid screen results. BTH101 E. coli are plated on M63 minimal media, supplemented with X-GAL, IPTG, and maltose as a carbon source.
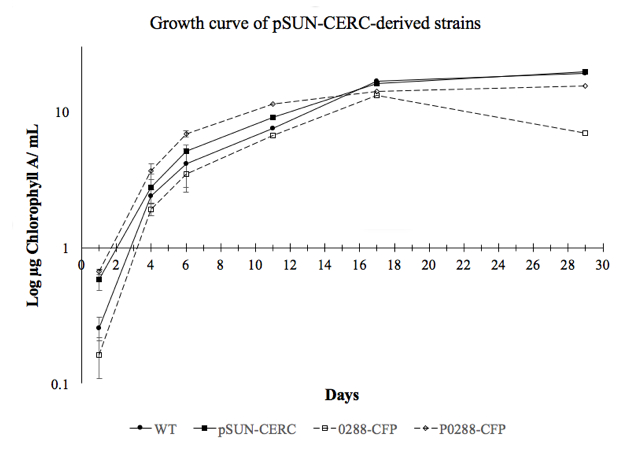
Growth curve comparing various strains I created in the lab. One experimental strain (0288-CFP) shows a clear deviation in growth—at 17 days—compared to WT and pSUN-CERC control strains. This deviation implies that genetic modification hinders the cell’s ability to survive in stationary phase.
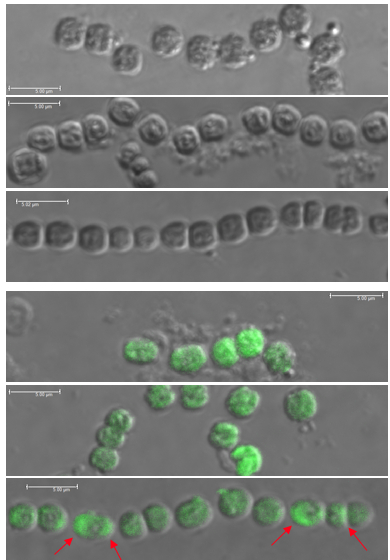
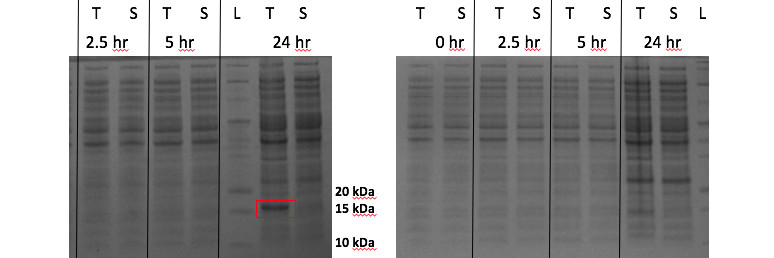
Immunostained filaments of N. punctiforme expressing empty FLAG vectors (Top 3) in early log phase, late log phase, and stationary phase. No fluorescence is seen.
Immunostained filaments of N. punctiforme expressing FLAG-tagged proteins (Bottom 3) in early log phase, late log phase, and stationary phase. Polar localization can be seen in stationary phase cells (red arrows).